Last updated: September 1, 2017
AceMap —— Scholarly Big Data VisualizationTeam Leader, Advisor: Prof. Xinbing Wang
|
Feb. 2016 - Present
|
AceMap Link: http://acemap.sjtu.edu.cn/ or http://acemap.openacademic.ai/
→What is AceMap?
AceMap is a novel academic system, which analyzes the scholarly big data and presents the results through a "map" approach. It integrates several algorithms in the field of network analysis and data mining, and then displays the information in a clear and intuitive way, aiming to help the researchers facilitate their work.
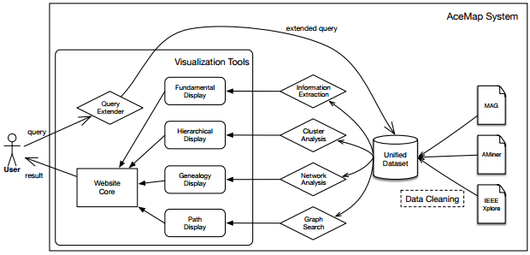
Fig. 1: The Architecture of AceMap System
→Features of AceMap
AceMap is more than an academic search engine. The biggest feature is various kinds of academic maps as follows.
- Academic Map: "paper galaxy"
- Topic Map: relations within and among 19 basic research fields
- Affiliation Map: academic information of different affiliations displayed on an interactive world map
- Paper Map [Ex.1] [Ex.2]: paper citation network in a certain research field
- Author Map [Ex.]: researchers network in a certain affiliation
- Co-author Map [Ex.]: coauthor network of a certain researcher
→Acheivements
AceMap website by far has around 3,000 daily visits. We are making progress to link map results in ChinaSo and Microsoft Academic.
→My Contributions
I am the leader of the "map" group, which is in charge of nearly all the visualization work of AceMap. Personally, I have developed 22,000+ "paper map", 2200+ "author map", and the "academic map", including data cleaning, visualization, and website design. Now I am improving the previous work and exploring new types of maps.
Paper Map
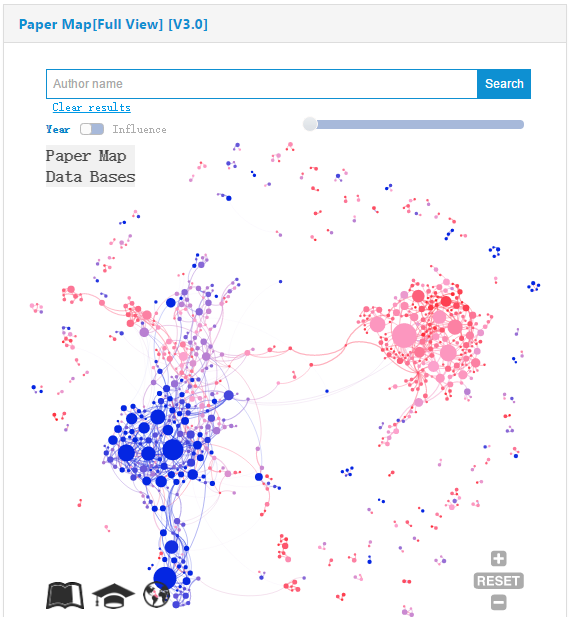
Fig. 2: Paper Map Example (Data Bases)
|
Paper Map shows paper citation network in a certain research field. The node represents paper and the edge represents citation; node color implies at which year the paper was published; node size indicates the influence of the paper.
There are plenty of functions implemented on the map.
|
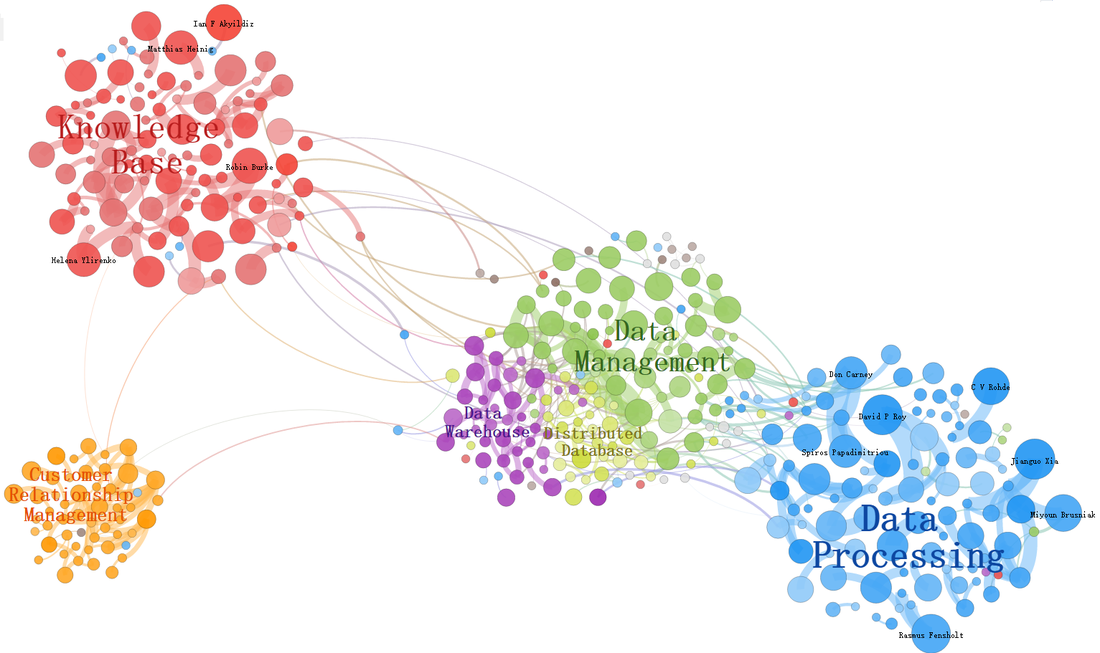
Fig. 3: Paper Map Example (Data Bases) (Version 3.0)
|
In the field of Computer Science, a new version of paper map was designed to show paper citation network according to subfield information. Papers (nodes) were colored and gathered by subfields, and subfields were labelled correspondingly. All functions mentioned above are also available in this version of paper map. |
Author Map
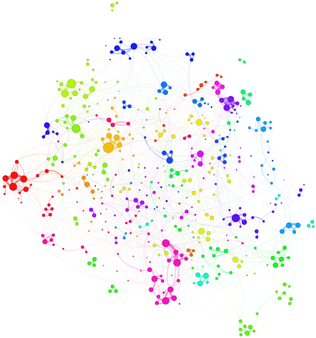
Fig. 4: Author Map Example (Tsinghua University)
|
Author Map shows researchers network in a certain affiliation. The node represents researcher and the edge represents co-author relationship; node color implies potential research group; node size indicates the influence of the researcher. Except that view switcher is disabled in the author map, all the other functions are available. |
Academic Map —— Paper Galaxy